How to Measure Progress: 6 EVM Methods from the 0/100 Rule to Physical Measurement
Progress is the output of a measurement method, not a guess — the six EVM methods (fixed formula, weighted milestone, percent complete, physical measurement, apportioned effort, LOE) and how to pick one for each kind of work.
Progress is not a number you ask someone for — it is a number a predetermined measurement method outputs. If "we're at 35%" cannot survive the question "how was that 35% produced?", the problem is not the reporter's honesty; it is the absence of a method. PMBOK — specifically PMI's practice standard for EVM (Earned Value Management) — defines six methods for measuring earned value (EV) and expects one to be assigned per task, based on the nature of the work. This guide walks through all six — what each is, how it computes, where it fits, where it breaks — then closes with a selection table and one worked example you can check by hand.
Why the method comes first
Numbers collected by asking "how far along are you?" are lengths measured with as many rulers as there are people. Shown the same state of work, an optimistic engineer says 80% and a cautious one says 60%. The moment you add those numbers up and average them, measurements taken with different rulers masquerade as one statistic.
Reverse the order and the problem disappears. Assign the measurement method per task, at planning time. Once "this task is 0% until done, 100% after" or "this task is counted in screens" is on record, anyone entering progress produces the same number. This is exactly why PMI's EVM practice standard defines EV measurement methods as their own concern — progress is data you derive, not data you collect.
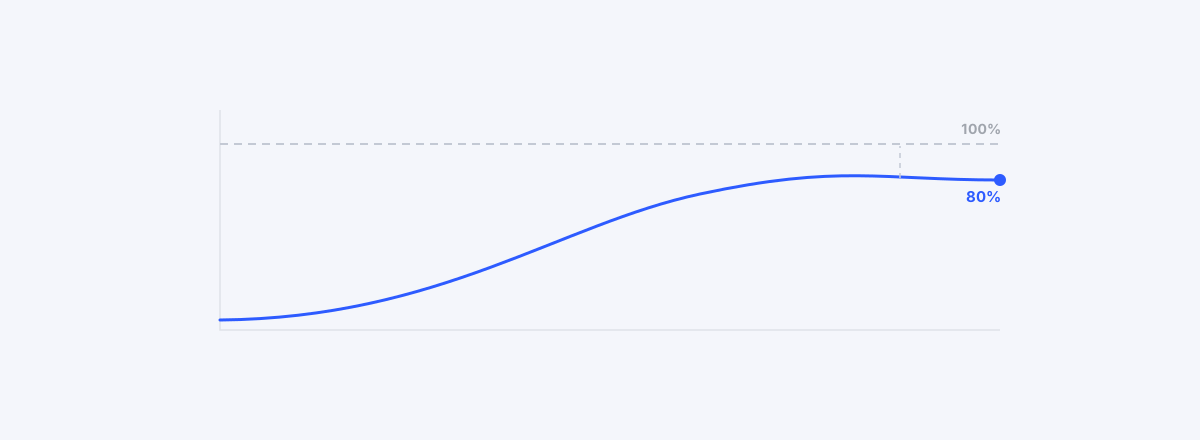
The pathology that discretionary percentages create — "80% done" staying 80% for eight weeks — is the subject of The Lie Called "80% Done". Here we take on the source of the remedy: the methods themselves.
Fixed formula — 0/100 and 50/50
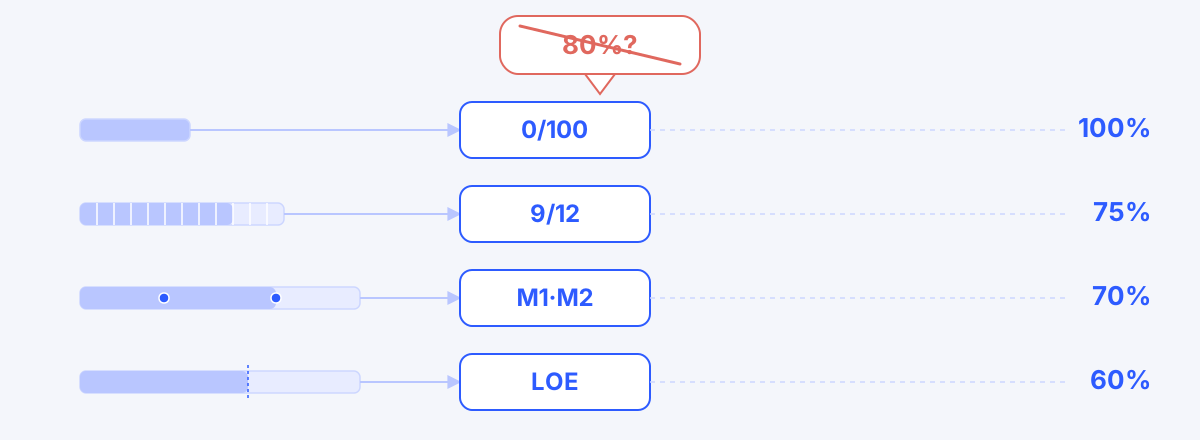
Definition: only two or three states are recognized. Under the 0/100 rule, a task is 0% until complete and 100% after. Under 50/50, it is 50% once started and 100% when complete. Nothing in between exists.
Calculation: the only judgments are states — has it started, is it complete and accepted. There is no room for discretion.
Fits: short tasks that finish within one or two reporting periods. A two-week task has no business carrying an intermediate value in a weekly report — 0 (or 50) this week and 100 the next is all the resolution you need.
Pitfall: applied to long work it produces staircase distortion. Put 0/100 on an eight-week task and EV sits at 0 for seven weeks, then jumps to 100 all at once — and for those seven weeks the schedule index reads worse than reality. Fixed formulas are for short tasks only.
Weighted milestone
Definition: cut a long task into interim deliverables (milestones), assign each a weight, and credit only the weights of milestones that have passed.
Calculation: split a task into design submitted 30, review passed 40, final approval 30 — then having passed the review, the task is at 70%. Anything between milestones stays at the value of the last one passed.
Fits: long work (three reporting periods or more) with clear interim deliverables. It slices the staircase distortion of the fixed formula into as many steps as there are milestones.
Pitfall: if milestone completion criteria are vague, the method degenerates into a discretionary percentage. Unless "design review passed" is defined at planning time — zero open findings, or merely the meeting held? — the judgment becomes opinion again.
Percent complete — the most common and the most dangerous
Definition: the assignee estimates a percentage at their own discretion, and that number is used as-is. It is what most tools offer by default and what most organizations actually use.
Calculation: there is none — that is the problem. The basis for the number exists only in the assignee's head.
Fits: the last resort, when nothing else applies. Use it only with two guardrails. First, completion criteria up front — before anyone enters progress, the task's definition of done must exist in writing. Second, an 85% ceiling — work still awaiting acceptance or inspection does not go to 90% or 95%. That final 15% routinely consumes half the calendar.
Pitfall: the method itself is the pitfall. Optimism enters wherever discretion exists. Percent complete without guardrails is collection, not measurement.
Physical measurement
Definition: count in countable units. Nine screens finished out of twelve is 75% — the count is the progress.
Calculation: units complete ÷ units total. The only judgment is whether each unit is done, and given completion criteria that is a fact check, not an opinion.
Fits: the best method for work with repeated units. Screens, APIs, test cases, tables to migrate, drawings — if the output can be counted, this method wins.
Pitfall: badly uneven unit sizes distort it. If the three screens remaining out of twelve are the most complex ones, 75% is an overstatement. When unit difficulty varies widely, weight the units (at which point you effectively have weighted milestones) or cut them finer.
Apportioned effort and LOE
The last two methods exist for work that cannot be measured by its own output.
Apportioned effort: for support work that tracks a base task in proportion. Quality review or technical documentation shadowing development is the classic case. The base task is at 70%, so the support task is at 70% — there is no separate measurement.
LOE (Level of Effort): for work where elapsed time is the progress. Project management, running the meeting cadence, keeping environments alive — anything that continues uniformly for the whole duration. 60% of the duration elapsed means 60% progress.
Pitfall: by definition, LOE's EV tracks PV exactly — delay is not a concept it can express. So when LOE carries a large share of a project, SPI is dulled toward 1. The real work can slip by half, and if LOE holds a big slice of the weight, the index worsens by that much less. Keep LOE to a small fraction of total weight.
Which method for which work
The six methods are not a ranking; they are a division of labor. The nature of the work picks the method.
| The work… | Method |
|---|---|
| Finishes within one or two reporting periods | Fixed formula (0/100, 50/50) |
| Produces countable output | Physical measurement |
| Is long, with clear interim deliverables | Weighted milestone |
| Is support work proportional to another task | Apportioned effort |
| Is management work that runs the whole duration | LOE |
| Is none of the above | Percent complete + completion criteria + an 85% ceiling |
Read top to bottom; the first row that fits is the method. It is no accident that percent complete sits in the last row — discretion is the option left after everything else is exhausted, and even then it arrives with two guardrails attached.
A worked example — five tasks, five methods
Five tasks with weights totaling 100, each assigned a different method, and one week's status snapshot. Every figure in the table checks out by hand.
| Task | Weight | Method | This week's status | Progress | Contribution |
|---|---|---|---|---|---|
| Requirements workshop | 10 | 0/100 | Complete, accepted | 100% | 10.0 |
| Screen design | 20 | Physical measurement | 9 of 12 screens | 75% | 15.0 |
| Development | 40 | Weighted milestone | M1 (30) + M2 (40) passed | 70% | 28.0 |
| Integration testing | 20 | 50/50 | Started | 50% | 10.0 |
| PM & QA | 10 | LOE | 60% of duration elapsed | 60% | 6.0 |
| Total | 100 | 69.0 |
Each row's contribution is weight × progress. Development has passed milestones M1 (30) and M2 (40), so it stands at 70% and contributes 40 × 0.70 = 28.0. Integration testing has started, so under the 50/50 rule it is 50% and contributes 20 × 0.50 = 10.0.
The overall 69.0% is a calculation, not an opinion. Nobody among the five was asked "what percent does it feel like?" — only status facts were collected (complete, counts, milestones passed, started, duration elapsed), and the methods output the numbers.
And that 69.0 becomes EV, as-is. Set it beside the PV that comes from the baseline and you get the schedule performance index — the calculation and how to read it continue in How to Calculate SPI and CPI.
Running it in a tool
The six methods share one property: whichever you use, the final output is a single %. That number is what the tool stores; the method is the protocol that produced it.
That is how wbsgantt is built, too — enter progress on leaf tasks and it rolls up through weights to project-level progress and EV. The tool does not enforce the methods themselves — there is no per-method automation such as milestone checklists or locked fixed formulas. So the method lives as a team protocol: write each task's measurement method and completion criteria into its WBS Dictionary entry, and the basis for the number sits right beside the task every time progress is entered.
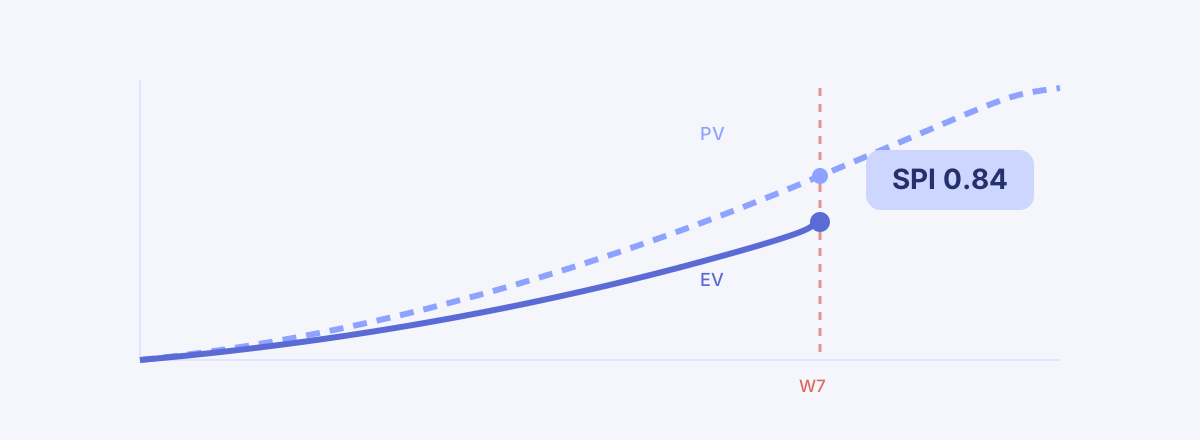
We recorded one project where progress entered this way actually raised the alarm — week seven of execution, SPI 0.84 sounding first, and the walk down to the responsible tasks — in Seven Weeks In, That ERP Project Started to Slip.
Where to go next
This guide is the middle of a trilogy. The first part, "The Lie Called '80% Done'", stated the problem — why a discretionary percentage sits at 80% for eight weeks. This one covered the source of the remedy: the six measurement methods and how to pick one per kind of work. The last part, "How to Calculate SPI and CPI", is where the progress obtained this way becomes an index — the EV your methods output, compared against the baseline's PV, reads schedule performance as a single number. Know the problem, fix the method, read the index — that order is the whole of progress management.
Frequently asked questions
- Who should enter progress?
- The default is that the person doing the work enters it and the PM verifies it. But the real question is not who — it is the method. Once a measurement method is assigned to the task, anyone entering progress produces the same number. An organization running on discretionary percentages alone has no alternative but the PM interviewing everyone every week, and numbers gathered that way were measured with as many different rulers as there are people.
- Should I use 0/100 or 50/50?
- Decide by task length relative to your reporting period. Finishes within one period → 0/100. Spans two periods → 50/50. Three periods or more → a fixed formula is the wrong tool entirely; switch to weighted milestones or physical measurement.
- Are progress and effort spent the same thing?
- No. Progress (EV) measures how much of the output exists; effort (AC) measures how much has been put in. Spending half the hours does not mean half the work is done. Keeping the two separate is precisely the condition that makes CPI (cost performance) meaningful.
- Do I have to ask for progress again every week?
- If methods are assigned, you don't ask — you count. What gets updated each cycle are status facts — milestones passed, units completed, whether work has started — not opinions.
- A task has been stuck at 90% for weeks. Now what?
- That is a signal the measurement method is wrong. Break the remaining work into countable units and switch to physical measurement. If acceptance or inspection is still ahead, apply the 85% ceiling and keep the number there until it clears.
Read next
 The Lie Called "80% Done"Progress stuck at 80% for eight weeks — EVM basics (PV/EV/AC, SPI/CPI) and honest progress rules.02
 Seven Weeks In, That ERP Project Started to SlipWith a baseline set and progress in, SPI 0.84 raised the alarm first — an execution report tracing the slip down to the responsible work packages.03
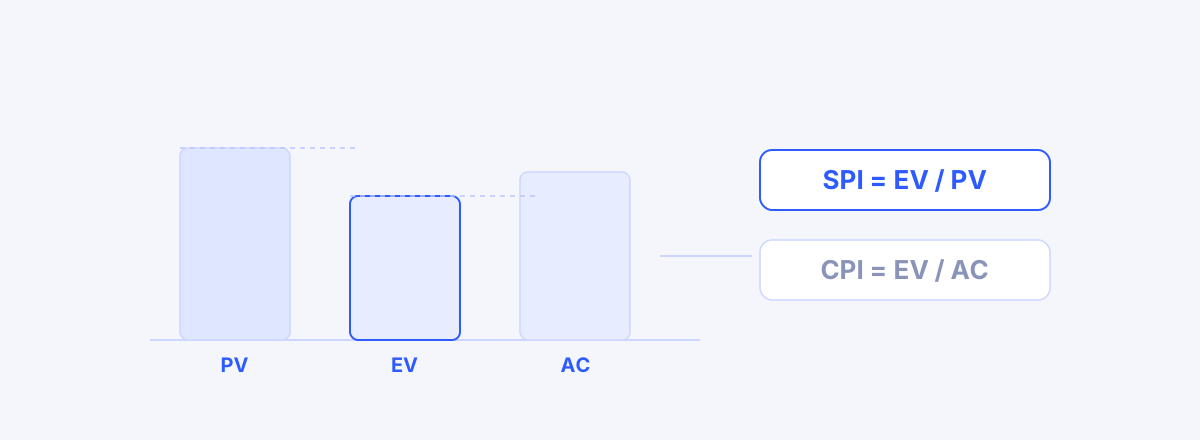 How to Calculate SPI and CPI: An EVM PrimerCompute and read SPI and CPI from three numbers — PV, EV, AC — with a worked example and the two cases where SPI lies.