How to Calculate SPI and CPI: An EVM Primer
Compute and read SPI and CPI from three numbers — PV, EV, AC — with a worked example and the two cases where SPI lies.
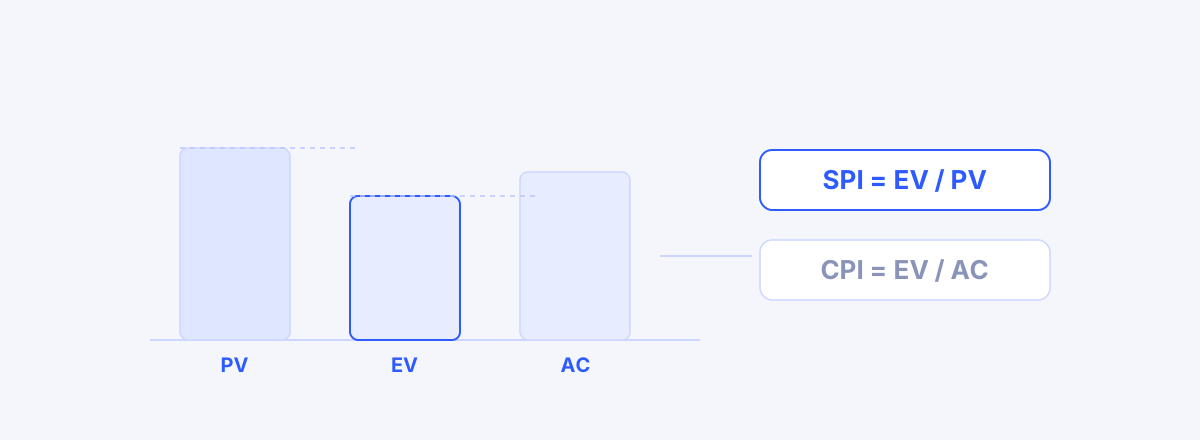
SPI answers schedule performance and CPI answers cost performance, each as a single number. The formulas are SPI = EV / PV and CPI = EV / AC. Below 1 means you are behind, or spending more than planned; at 1 you are on plan. Turning "we're about 80% done" into "SPI 0.86" is the entire point of EVM (Earned Value Management).
The question SPI and CPI answer
The two indices answer different questions. SPI asks "are we moving at the planned pace?" and CPI asks "are we buying it at the planned price?" Both read against 1, so saying "we're at 0.86" in a meeting conveys the state without further explanation — which is the whole reason to move status reporting from percentages to indices.
One caution: neither index tells you the cause. Why 0.86 came out that way is visible only in the per-task contributions underneath it, not in the index. This is how to compute both by hand from three numbers — PV, EV, AC — how to read the result, and how to walk down to the tasks that produced it. Every figure in the tables checks out arithmetically.
First, three numbers: PV, EV, AC
- PV (Planned Value) — the value that should have been completed by today. It comes from the baseline.
- EV (Earned Value) — the value actually completed by today. It comes from current progress.
- AC (Actual Cost) — what has actually been spent by today. It comes from accounting or timesheet actuals.
The fork in the road is what unit "value" is in. Formal EVM assigns each task a budget (BAC, Budget at Completion) and computes in money. Organizations without cost data use weight as a proxy for value instead — each task holding a share of 100 that reflects its relative size.
A property of the weight approach is worth knowing. BAC becomes 100 rather than an amount, so the unit cancels out of the SPI calculation entirely. SPI is computable without any cost data. CPI is not: it needs AC. That asymmetry is exactly why "lightweight EVM" in practice means "SPI-centered."
Calculating SPI: a worked example
A project with five tasks whose weights total 100. For today, we place each task's planned progress (elapsed share between baseline start and finish) beside its actual progress.
| Task | Weight | Planned | Actual | PV contribution | EV contribution |
|---|---|---|---|---|---|
| Requirements | 20 | 100% | 100% | 20.0 | 20.0 |
| High-level design | 20 | 100% | 100% | 20.0 | 20.0 |
| Detailed design | 15 | 80% | 60% | 12.0 | 9.0 |
| Development | 30 | 40% | 20% | 12.0 | 6.0 |
| Testing | 15 | 0% | 0% | 0.0 | 0.0 |
| Total | 100 | 64.0 | 55.0 |
Each row's contribution is weight × progress. Development, for instance: 30 × 0.40 = 12.0 (PV) and 30 × 0.20 = 6.0 (EV).
- SPI = EV / PV = 55.0 / 64.0 = 0.86
- SV (Schedule Variance) = EV − PV = 55.0 − 64.0 = −9.0 percentage points
How to read it: on plan you should have earned 64% by now; you earned 55%. Progress is running at 86% of planned pace.
Notice that the table already tells you which tasks are the problem. Detailed design (−3.0) and development (−6.0) produce the entire −9.0 shortfall. Standing the contributions up task by task and reading from the largest negative is far closer to action than staring at one aggregate SPI.
Calculating CPI: a worked example
CPI compares the same EV against cost. Say the project's total budget (BAC) is $1.0M and $620k has actually been spent to date. EV is 55% of the work, so in money it is $550k.
| Value | Amount | Basis |
|---|---|---|
| BAC (total budget) | $1,000k | plan |
| PV | $640k | BAC × 64% planned progress |
| EV | $550k | BAC × 55% actual progress |
| AC (actually spent) | $620k | accounting actuals |
- CPI = EV / AC = 550 / 620 = 0.89
- CV (Cost Variance) = EV − AC = 550 − 620 = −$70k
- EAC (Estimate at Completion) = BAC / CPI = 1,000 / 0.89 = about $1,124k
How to read it: you are spending $1.12 to buy $1.00 of work. Hold that efficiency to the end and the project lands around $1.12M — roughly $124k over budget.
A caveat: CPI, CV, and EAC all require AC. In organizations where cost actuals live in the accounting system rather than the project tool, these numbers don't appear automatically. wbsgantt does not handle cost data today and therefore computes SPI only — it does not provide CPI. The calculation above is conceptual; cost indices have to be derived alongside accounting data.
Reading the number: between 0.9 and 1.1
Read these indices as bands, not decimals.
| Value | State | Action |
|---|---|---|
| Below 0.90 | Material delay or overrun | Identify the responsible tasks → recovery plan or change request |
| 0.90 – 0.95 | Warning | Check the two-week trend; is the task on the critical path? |
| 0.95 – 1.05 | Effectively on plan | No action (within measurement noise) |
| 1.05 – 1.10 | Ahead | Sanity-check that progress isn't being scored generously |
| Above 1.10 | Suspicious | Usually over-reported progress or a slack baseline |
That last row matters. When SPI looks too good, doubting the plan or the measurement is the correct response. A project reporting 1.2 in practice is usually not excelling; it is scoring progress generously or working against a baseline with too much padding.
One more thing: the trend beats the value. SPI at 0.92 for three straight weeks is a managed situation. 0.98 → 0.95 → 0.92 is a different story at the same value.
Rules that keep progress honest
SPI's credibility rests entirely on EV's credibility — that is, on honest progress measurement. Why "80% done" stays 80% for eight weeks is the subject of The Lie Called "80% Done"; here are just the remedies.
- 0/50/100 — 0% before start, 50% once under way, 100% when complete and accepted. No numbers in between. Especially powerful for short tasks.
- Physical measurement — count in countable units: "7 of 12 screens done = 58%." The point is to outlaw percentages produced by feel.
- Acceptance criteria first — a task needs defined completion criteria before anyone enters progress against it. Without them, nobody can adjudicate 100%.
- An 85% ceiling — work still awaiting inspection or acceptance does not go to 95% or 99%. That final 15% routinely consumes half the calendar.
What these rules share is that they reduce the PM's discretion. Optimism enters wherever discretion exists, and SPI computed from optimistic EV hides risk instead of revealing it.
Two cases where SPI lies
First, the baseline is missing or stale. PV comes from the baseline. Without one there is no PV and SPI cannot be computed at all. The more common trap is a baseline that never absorbed the approved changes — scope grew but the reference line didn't, so SPI reads worse than reality; or someone quietly re-baselined and the delay vanished from the statistics. The heart of that problem is in Your Schedule Didn't Slip — Your Baseline Disappeared.
Second, the weights are distorted. In the weight approach, EV and PV are both proportional to weight. If siblings don't sum to 100, or a large task carries a small weight, SPI is quietly wrong. Give a development task that consumes half the total effort a weight of 10, and the whole thing can slip while SPI sits near 0.95. Weight validation therefore has to be finished before you look at SPI at all.
We recorded one project actually being warned by SPI — week seven of execution, 0.84 raising the alarm first, and the walk down through an S-curve and a top-delay list to the responsible work packages: Seven Weeks In, That ERP Project Started to Slip.
Where to go next
Three things have to stand before SPI means anything — a WBS with validated weights, an approved baseline, and honestly entered progress.
wbsgantt computes SPI on that foundation. Sibling weights are auto-distributed toward 100 and flagged with a violation badge when they drift, the baseline persists as an immutable snapshot, and PV is derived by interpolating the baseline schedule linearly across calendar days. On screen the SPI card sits beside a planned-versus-earned (PV/EV) S-curve and a list of the tasks contributing most to the delay — the goal being not a single number but the walk down to the tasks causing it. Cost indices (CPI, EAC) are left for the stage where a cost baseline enters the model.
Frequently asked questions
- Does SPI 1.0 mean everything is fine?
- It means your pace matches the plan exactly — but "fine" depends on the quality of that plan. On a slack baseline, 1.0 is not a good signal. SPI also speaks only to schedule, so it can read 1.0 while cost runs over. Read the trend across three weeks alongside the value.
- Should I look at SPI or CPI first?
- Usually SPI — schedule slippage surfaces before cost overrun, and you have more recovery options. But the real information is in the combination: SPI<1 with CPI<1 says the plan itself was optimistic, while SPI<1 with CPI>1 says you are under-resourcing the work (spending less because fewer people are on it).
- Can I calculate SPI without a baseline?
- No. PV comes only from a baseline schedule. Compute it against the current plan and PV shifts every time the plan changes, which makes delay disappear from the statistics — precisely why a baseline has to persist as an immutable snapshot.
- How is SV different from SPI?
- They express the same gap differently. SV = EV − PV is the absolute amount (−9.0 percentage points in the example); SPI = EV / PV is the ratio (0.86). The absolute figure conveys magnitude; the ratio compares cleanly across projects and periods. Reporting both is the safe habit.
- How do I calculate EAC?
- The simplest form is EAC = BAC / CPI, which assumes today cost efficiency holds to the end. If the cause was one-off, use EAC = AC + (BAC − EV); if both schedule and cost performance are poor, use a conservative form like EAC = AC + (BAC − EV) / (CPI × SPI). Every variant needs AC, so none of them are available without cost actuals.
Read next
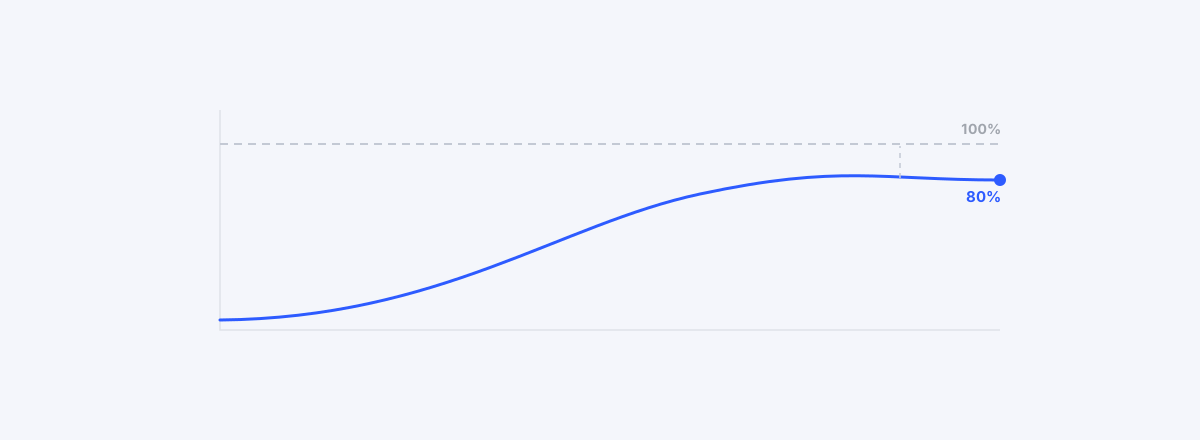 The Lie Called "80% Done"Progress stuck at 80% for eight weeks — EVM basics (PV/EV/AC, SPI/CPI) and honest progress rules.02
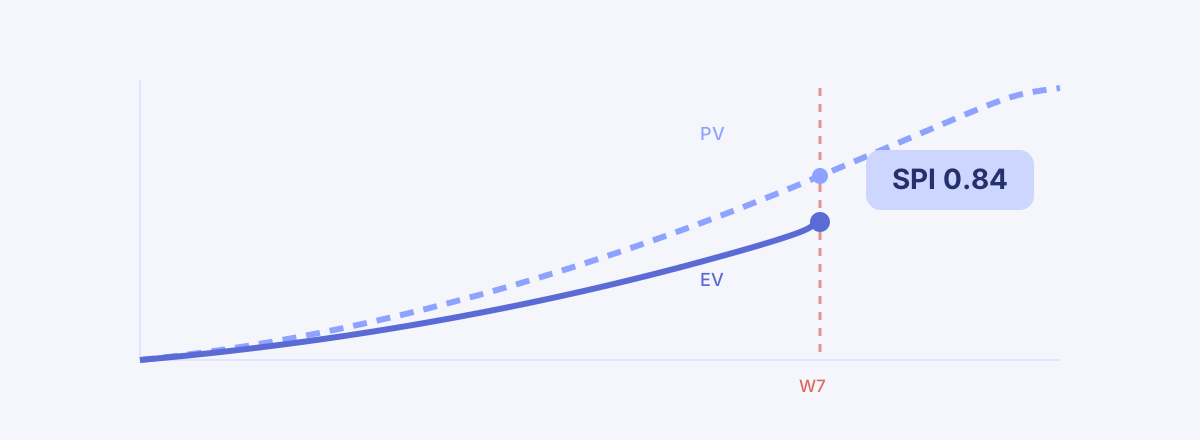 Seven Weeks In, That ERP Project Started to SlipWith a baseline set and progress in, SPI 0.84 raised the alarm first — an execution report tracing the slip down to the responsible work packages.03
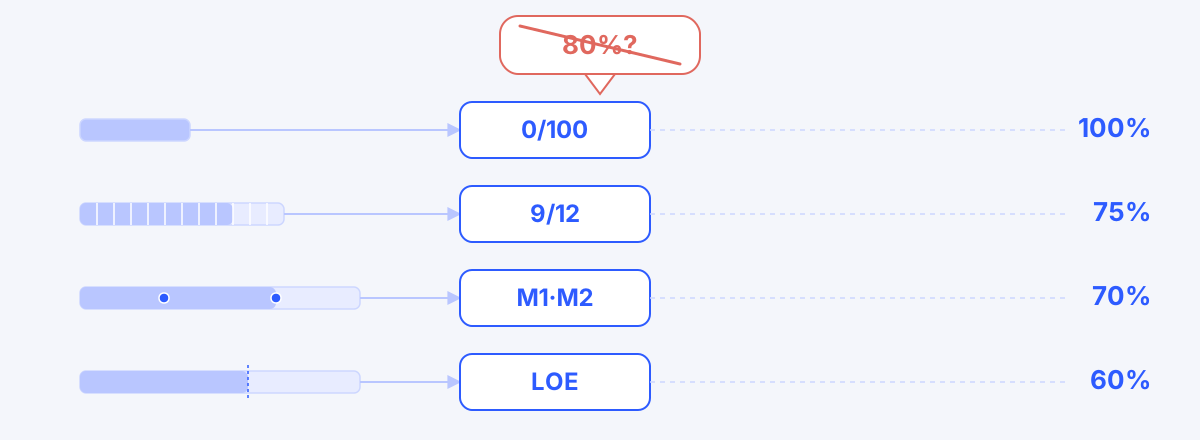 How to Measure Progress: 6 EVM Methods from the 0/100 Rule to Physical MeasurementProgress is the output of a measurement method, not a guess — the six EVM methods (fixed formula, weighted milestone, percent complete, physical measurement, apportioned effort, LOE) and how to pick one for each kind of work.