The Lie Called "80% Done"
Progress stuck at 80% for eight weeks — EVM basics (PV/EV/AC, SPI/CPI) and honest progress rules.
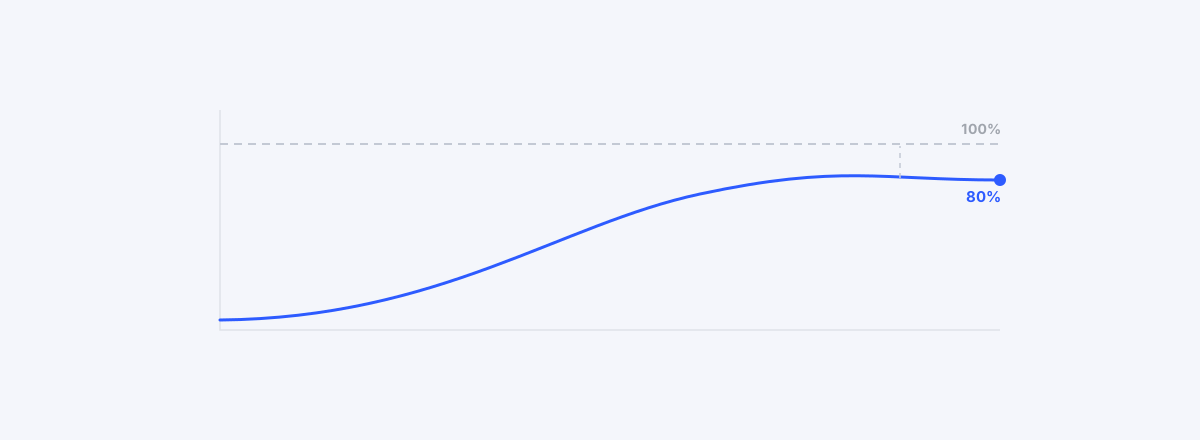
Weekly status meeting. "The settlement module is 80% complete." It was 80% last week too. The week before, 75%. There's an old joke among PMs: the first 80% of a project takes 80% of the time, and the remaining 20% takes the other 80%.
It's not a joke — it's a structural phenomenon. And the cause is not that people lie. It's that the question is wrong.
"What percent done?" is an unanswerable question
Asking "what percent are you at?" demands two impossible things: accurately estimate the remaining work, then compress that estimate into a single number. Humans can do neither. Estimating remaining work, in particular, sits squarely in the territory of optimism bias — one of psychology's most replicated findings. So out comes "80%": the social expression of I've done a lot and it'll be done soon. Eighty percent is not a measurement. It is a mood.
A dashboard that aggregates moods paints the whole project green. Then, in the final month, all the red appears at once. Every PM knows that final month.
Two rules that turn mood into measurement
Rule 1 — Don't ask for progress. Derive it from rules.
Proven crediting rules exist that remove subjectivity:
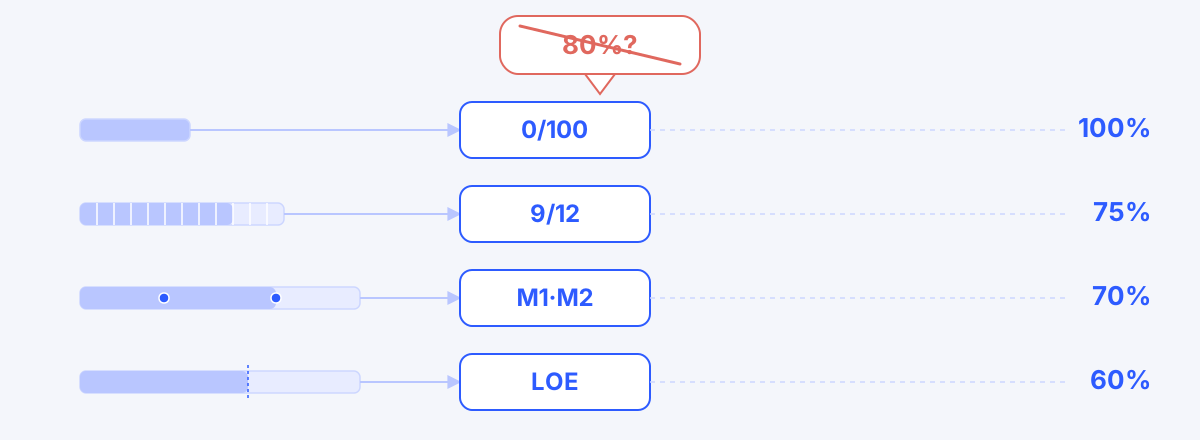
- 0/100: a task is 0% until done, 100% when done. The most conservative and the most honest. If your work is decomposed into 8–80 hour packages (the 8/80 Rule from Part 1 pays off again here), this rule alone is precise enough.
- 50/50: 50% when started, 100% when finished. For work where starting itself is meaningful.
- Weighted milestones: for long tasks, pre-define verification points (design complete 30%, implementation 70%, tests passed 100%) and credit progress only when a point is passed.
The common thread: progress comes from events, not opinions. Not "feels like 80%," but "tests passed, therefore 100%."
Which rule fits which work is decided by size and nature:
| Rule | Best for | Watch out |
|---|---|---|
| 0/100 | Short work packages (≤2 weeks) | Requires fine-grained decomposition |
| 50/50 | Mid-size tasks where starting is meaningful | Can inflate started-then-stalled work |
| Weighted milestones | Long tasks (4+ weeks) with clear verification points | Weights must be agreed before starting |
And whichever rule you use, there is one precondition: a Definition of Done. Declaring "done" requires that a deliverable exists, review is finished, the designated approver has approved, and test criteria have passed. For a task without these four defined, even a 0/100-credited 100% is still a mood.
Rule 2 — Separate progress from performance.
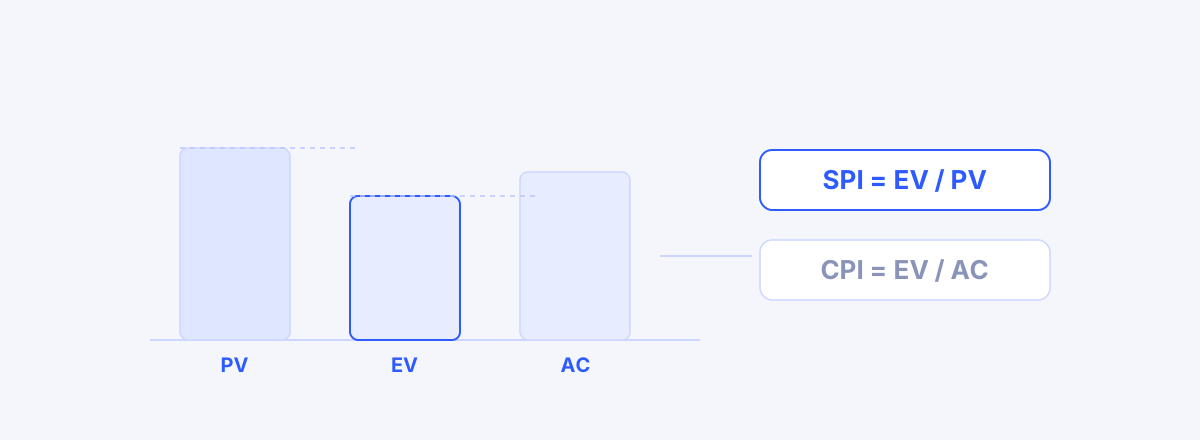
If half the schedule has elapsed and half the tasks are done, is the project healthy? Unknowable — if the finished half was the easy half, you're actually in danger. To resolve this, Earned Value Management (EVM) distinguishes three quantities:
- PV (Planned Value): the value of work you planned to have done by now
- EV (Earned Value): the value of work actually completed by now
- AC (Actual Cost): what you've actually spent by now
Two ratios follow. SPI = EV/PV (below 1 means behind schedule) and CPI = EV/AC (below 1 means over budget). An SPI of 0.85 converts "we feel a bit behind" into "we are moving at 85% of planned velocity." Conversations with sponsors change; early warning becomes possible. CPI is an especially powerful predictor — a long-standing finding of EVM research is that CPI at the 20% mark forecasts final cost with unsettling accuracy.
Let's run the numbers once. A 10-week project, total budget (BAC) $100K. Week 5 has just ended.
- PV = value of work planned to be done by week 5 = $50K
- EV = budget sum of work actually completed (credited by rule) = $40K
- AC = actual cost incurred = $48K
So SPI = 40/50 = 0.80 — moving at 80% of planned velocity; at this rate the project takes 12.5 weeks, not 10. CPI = 40/48 = 0.83 — spending $1.20 for every $1.00 of work; if this efficiency holds, final cost lands near $120K (BAC/CPI), not $100K. These are sentences that can never emerge from "feels like 80% done." And every ingredient is data you already have: per-task budgets, completion events, actual costs.
The myth that EVM is hard
Born in defense and construction megaprojects, EVM carries a reputation for heaviness. But its essence is three multiplications. If every task has a budget (or effort) assigned and progress is credited by rule, then PV, EV, and AC are values a system can compute automatically. The hard part was never the formulas — it's keeping the underlying data consistent. That's exactly what we found while building a PM tool: when the WBS and progress data live in one place, SPI and CPI come along for free. When the data is scattered, no PhD can save you.
Try one experiment at your next weekly meeting. Instead of "what percent done?", ask: "Which tasks are finished, and which remain?" The moment the answer arrives as a list, the mood called 80% has nowhere left to stand.
The PM's action block
Three things to do tomorrow
- Agree and document the four elements of Definition of Done with the team (deliverable, review, approval, tests)
- Assign a progress rule (0/100, 50/50, weighted milestone) to every task in flight
- From the next report, switch the format from a percentage to "done list / remaining list + SPI"
Questions to ask in the next meeting
- "You said done — who approved it?"
- "Which rule credited this task's progress?"
- "SPI has been under 0.9 for three weeks — what's the recovery plan?"
Warning signs — if you see even one, distrust the progress data
- A task sitting at the same percentage for 3+ weeks
- A task parked above 90% long-term
- A task reported above 80% before testing has started
- A team where each member credits progress by a different standard
Good signs / bad signs
| Good signs | Bad signs |
|---|---|
| Progress arrives as a list of completions | Progress arrives as a single percentage |
| A falling SPI becomes a meeting agenda item | All the red lights turn on in the final month |
| Every "done" has an approver | "Almost done" is an official status |
What a tool should solve
EVM's barrier to entry was never the formulas — it's data consistency. In wbsgantt, once each task carries an effort figure and a progress rule, PV, EV, AC, and SPI/CPI compute automatically on the dashboard — no side spreadsheet. We wanted to prove structurally that once the disciplines of Parts 1–3 are in place (decomposition, single model, baseline), performance measurement comes along for free.
Read next
 How to Calculate SPI and CPI: An EVM PrimerCompute and read SPI and CPI from three numbers — PV, EV, AC — with a worked example and the two cases where SPI lies.02
 How to Measure Progress: 6 EVM Methods from the 0/100 Rule to Physical MeasurementProgress is the output of a measurement method, not a guess — the six EVM methods (fixed formula, weighted milestone, percent complete, physical measurement, apportioned effort, LOE) and how to pick one for each kind of work.