How to Make a Gantt Chart: From WBS to a Working Schedule
A Gantt chart is computed, not drawn — five steps from WBS through durations, dependencies, CPM and a baseline, plus where Excel Gantt charts fall apart.
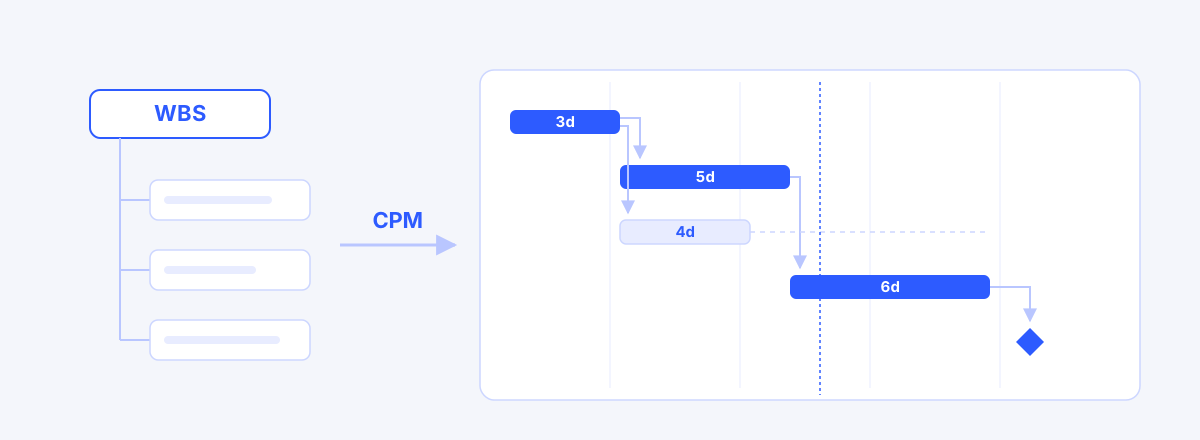
A Gantt chart is not a drawing — it is a computed result. Feed it a task list, a duration for each task, and the order between tasks, and a schedule comes out. The moment you start dragging bars around to make the picture look right, the chart stops being a plan and becomes an illustration. This guide walks through the five steps of building a Gantt chart in that order — task list (WBS), durations, dependencies, computation (CPM), and a baseline. It closes with a six-task example you can verify by hand, and a look at exactly where spreadsheet Gantt charts fall apart.
What a Gantt Chart Holds
A Gantt chart has five elements. Horizontal bars carry tasks and their durations. Diamonds mark milestones — zero-duration dates of commitment. Dependency lines between bars express order; a vertical today line marks the present; and a baseline overlay shows the approved plan underneath the current one.
Everything on that list is information about time. What gets built, and how the work is divided, belongs not to the Gantt chart but to the WBS. The Gantt is a map of time; the map of scope lives elsewhere — and when that boundary blurs, you lose the ability to tell a schedule change from a scope change.
Step 1 — The Task List Comes from the WBS
The rows of a Gantt chart are not a to-do list transcribed from a meeting. Each row should come from the lowest level of the WBS — the work packages. The reason is simple: a WBS is a decomposition of scope validated to sum to 100%, so starting there makes missing work visible before it becomes a missing row. Start from an improvised list instead, and whatever the list forgot, the schedule forgets too — and you find out mid-execution.
The WBS also tells you when a row is the right size. If leaf tasks land between 8 and 80 hours (the 8/80 Rule), they are the right grain for Gantt rows. How to do the decomposition itself is covered in How to Create a WBS: 5 Steps.
Step 2 — Estimate Durations in Working Days
Give each task a duration — in working days, not calendar days. A "five-day task" doesn't finish five days later; it finishes on the fifth working day. Weekends and holidays get skipped, so a five-day task started on Thursday ends the following Wednesday. A schedule estimated in calendar days starts diverging from reality at the first long weekend.
If estimating feels hard, the task is usually too big. Work broken down to 8/80 size carries estimation error of a day or two — a size you can manage. Estimating many small durations and summing them beats guessing "this phase takes two months" in one gulp, every time.
Step 3 — Order by Dependency, Not by Date
The order between tasks is expressed by linking predecessor to successor — not by typing start dates. The default link is FS (Finish-to-Start): the most common promise, "the successor starts only after the predecessor finishes."
Pinning dates and drawing links look identical until a predecessor slips — then they behave in opposite ways. A linked successor moves with the slip, and the delay shows up on the chart. A hand-typed date stays put and reports "no delay," which is false. Keep pinned dates for the few genuinely fixed constraints — contract deadlines — and express everything else as links. The other three link types (SS, FF, SF) and lead/lag are covered in Gantt Dependencies Explained.
Step 4 — The Schedule Is Computed: CPM
One project start date, a duration per task, and the dependency links. With those three in place, each task's start and finish stop being values you type and become values that are computed. The method is CPM (the Critical Path Method): starting from the project start, sweep forward along the links (the forward pass) and derive each task's earliest start and finish. That sweep is your schedule.
The computation yields two by-products worth more than the dates themselves. One is the critical path — the longest route from start to finish. A one-day slip on this path is a one-day slip for the whole project. The other is float: tasks off the critical path can slip some amount without moving the end date, and float is exactly that allowance. Which task is genuinely urgent, and which can wait, stops being a feeling and becomes a number.
Step 5 — Mark Milestones, Then Lock a Baseline
Onto the computed schedule go the milestones — zero-duration points of commitment: launch, acceptance sign-off, a contractual delivery date. A milestone says "on this date, this state." Giving a milestone duration mixes the promise with the work, so milestones stay at zero days.
When the plan is approved, lock the whole schedule as a baseline. A baseline is an immutable snapshot, and every "we slipped" or "we gained" from then on is measured as a difference against it. Without one, the reference moves every time you edit the plan — and delay quietly disappears from the statistics.
A Worked Example — Six Tasks, by Hand
Say a small website renewal decomposes into six tasks. Durations are working days.
| Task | Duration | Predecessor | Start | Finish |
|---|---|---|---|---|
| A Requirements | 3d | — | day 1 | day 3 |
| B Screen design | 5d | A | day 4 | day 8 |
| C Content writing | 4d | A | day 4 | day 7 |
| D Development | 6d | B | day 9 | day 14 |
| E Acceptance review | 2d | C, D | day 15 | day 16 |
| M Launch (milestone) | 0d | E | day 16 | day 16 |
Follow the computation. A finishes on day 3, so B and C start on day 4. E has two predecessors — C finishes day 7, D finishes day 14 — and a successor waits for the later one, so E starts on day 15. That is the entire forward pass: each task's start = the day after the latest finish among its predecessors.
The longest route is A→B→D→E→M: 3+5+6+2 = 16 working days. That is the critical path. C, meanwhile, finishes on day 7 but isn't needed until day 14 — seven days of float. The same slip lands differently depending on where it falls: if B slips two days, D moves to days 11–16, E to days 17–18, and launch lands on day 18 — the slip propagates in full. If C slips two days, launch doesn't move at all — the slip stays inside the float.
One more thing: 16 working days is roughly 22 calendar days (three weekends). This is where Step 2's working-day estimate earns its keep — counted in calendar days, the launch would have been promised six days early.
How to Read the Chart
Read a finished chart against three signals. First: is a bar on the critical path slipping? That delay propagates in full to the project end, so it gets checked first. Second: is there a bar past the today line whose progress hasn't kept up? That's a delay in progress, right now. Third: has a bar drifted right of its baseline? That task has left the approved plan.
The three signals share one property: nobody inspects for them by hand — the chart surfaces them as computed results. For a blow-by-blow account of one task's three-day slip riding the dependency lines through a real schedule, see If One Task Slips Three Days.
Where Spreadsheet Gantt Charts Fall Apart
A Gantt chart made by coloring spreadsheet cells is fine for a first draft or a one-off report. The trouble starts at execution. A colored-cell Gantt has no dependencies — a predecessor slips and the successor bars stay put, so the chart reports "no delay" and lies. Recomputation is entirely manual, so every change means recoloring everything downstream, and within days nobody updates it. Nobody knows the critical path. There is no baseline, so "what was the original plan" isn't recorded anywhere.
The summary is this: a spreadsheet Gantt is a picture of a schedule; what this guide built is a model that computes one. Pictures are easy to make; models are strong when things change. Projects always change.
What to Read Next
This guide is the middle leg of a journey. The step before it — dividing the work so it sums to 100% — belongs to the WBS guide, and the grammar of the lines between tasks belongs to the dependency guide. What happens when the schedule you built here starts wobbling in execution, the critical path case study shows with real data. In wbsgantt the journey runs in one screen: build the WBS tree and the Gantt follows automatically, with CPM and a working-day calendar (Korean public holidays included) built in — the computing parts of this guide's five steps are the tool's job.
Frequently asked questions
- If I have a Gantt chart, do I still need a WBS?
- The rows of your Gantt chart are the lowest-level tasks of a WBS — the work packages. Draw the Gantt first without one and your row list becomes an improvised decomposition, with no structure to check that it sums to 100%, so missing work goes missing from the schedule too. The order is: fix the scope with a WBS, then attach durations and sequence to the leaves. The result of that is the Gantt chart.
- Can I just build the Gantt chart in Excel?
- For a first draft or a one-off report, absolutely. The trouble is execution: a colored-cell Gantt has no dependencies, so when a predecessor slips the successor bars stay put; recomputation, the critical path, and baselines are all manual. The moment it becomes a weekly-updated execution tool, the cost of maintaining it passes the cost of making it.
- Is it OK to adjust the schedule by dragging bars?
- It depends on what actually changed. If the work grew, change the duration; if the order changed, change the dependency — that keeps the computation intact. Drag a bar to move only its start date and that date becomes pinned, detached from its predecessors; when they slip later, the task stays put and the schedule starts lying. Pin dates only for genuinely fixed constraints, like contractual deadlines.
- How often should a Gantt chart be updated?
- Progress every reporting cycle (usually weekly); structure — durations and dependencies — whenever a change actually happens. On a dependency-driven Gantt, updating isn't redrawing; it's entering the changed value and letting recomputation do the rest. If updates feel like a burden, the problem is usually the chart's construction (manual dates, colored cells), not the discipline.
- Past a hundred tasks the chart gets unreadable. How do I work with it?
- The trick is to stop trying to see everything at once. Day to day, collapse to phase (summary) level; for delay checks, look only at critical-path bars; for reporting, pull just the milestones. No meeting needs all hundred rows at once — reading a Gantt is the skill of folding it to the altitude of the question being asked.
Read next
 A Plan Made in Excel Starts Dying the Day It's BornWBS in one file, Gantt in another — two weeks later they disagree. Why plan artifacts and execution data belong in a single model.02
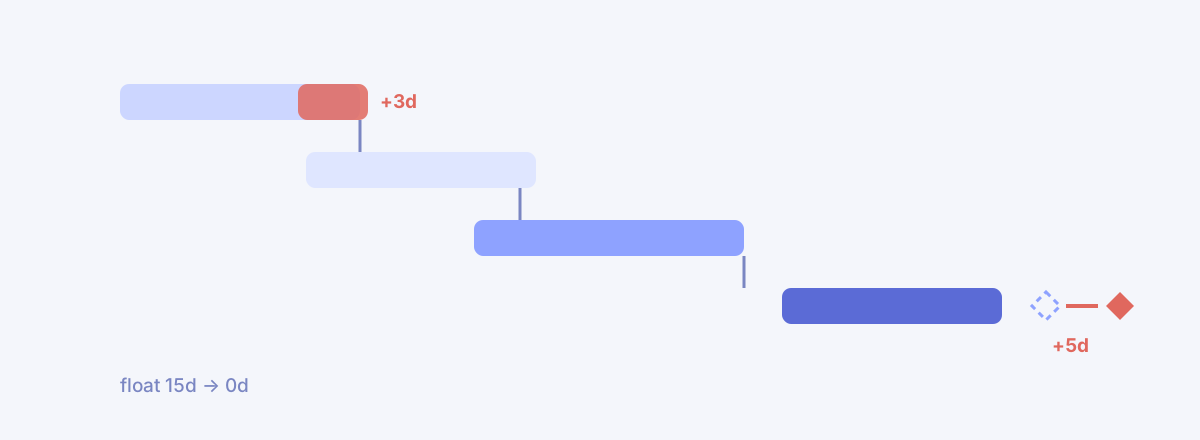 If One Task Slips Three Days, How Late Is the Project?We fed in +3 days and CPM recomputed the chain — zero delay at first, until a missing line surfaced. Fill it in, and the critical path moved house.03
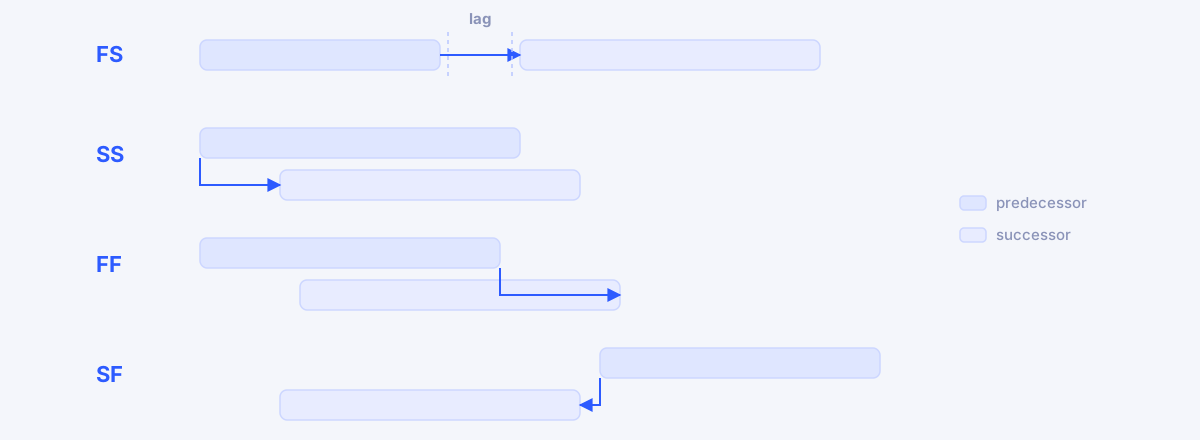 Gantt Dependencies Explained: FS, SS, FF, SF and Lead/LagWhat FS, SS, FF, and SF each promise, and where lead and lag belong — get them wrong and your critical path lies to you.04
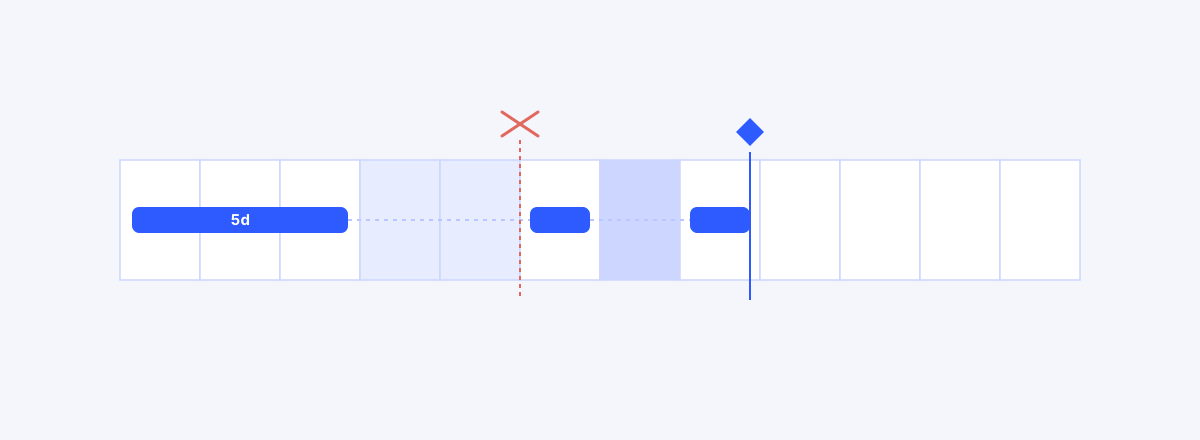 Scheduling in Working Days, Not Calendar DaysA five-day task isn't due five days from now — calendar vs working days, three traps in Korean public holidays, per-project calendars, and a deadline computation you can verify by hand.05
 Choosing a Microsoft Project Alternative: What Actually MattersMicrosoft Project is the deepest scheduling engine around — people look for alternatives not because it is bad, but because it does not fit. Four criteria for choosing: WBS, baselines, honest schedule computation, and whether your team will use it.